Agent Observability in Microsoft AI: Monitoring and Evaluation in Production
· 10 min read
By Juan Pedro Márquez
Agent observability in the Microsoft stack is three separate things wired together: product analytics that tell you an agent is busy, OpenTelemetry traces that tell you what it did, and evaluations that tell you whether it was right. Most enterprises turn on the first one, call it monitoring, and ship.
That is how an agent degrades for eleven weeks without anyone noticing.
I keep seeing the same shape of failure. An agent goes live after a clean pilot. Six weeks later someone reorganises a SharePoint library, or a tool's API changes a field name, or a model deployment gets swapped for a newer version. The agent keeps answering. Sessions still go up. Engagement rate looks fine. The answers are quietly wrong, and the only detection mechanism in the building is a user who eventually complains loudly enough to reach IT.
Nothing in the usage dashboard would have caught that. Usage dashboards measure attention, not correctness.
What does agent observability actually mean in the Microsoft stack?
It means three layers with different owners: in-product analytics (how much the agent is used and whether conversations resolve), telemetry exported to Application Insights (what the agent actually executed, step by step), and evaluation (a score on whether the output met a defined standard). You need all three. They answer different questions and none substitutes for another.
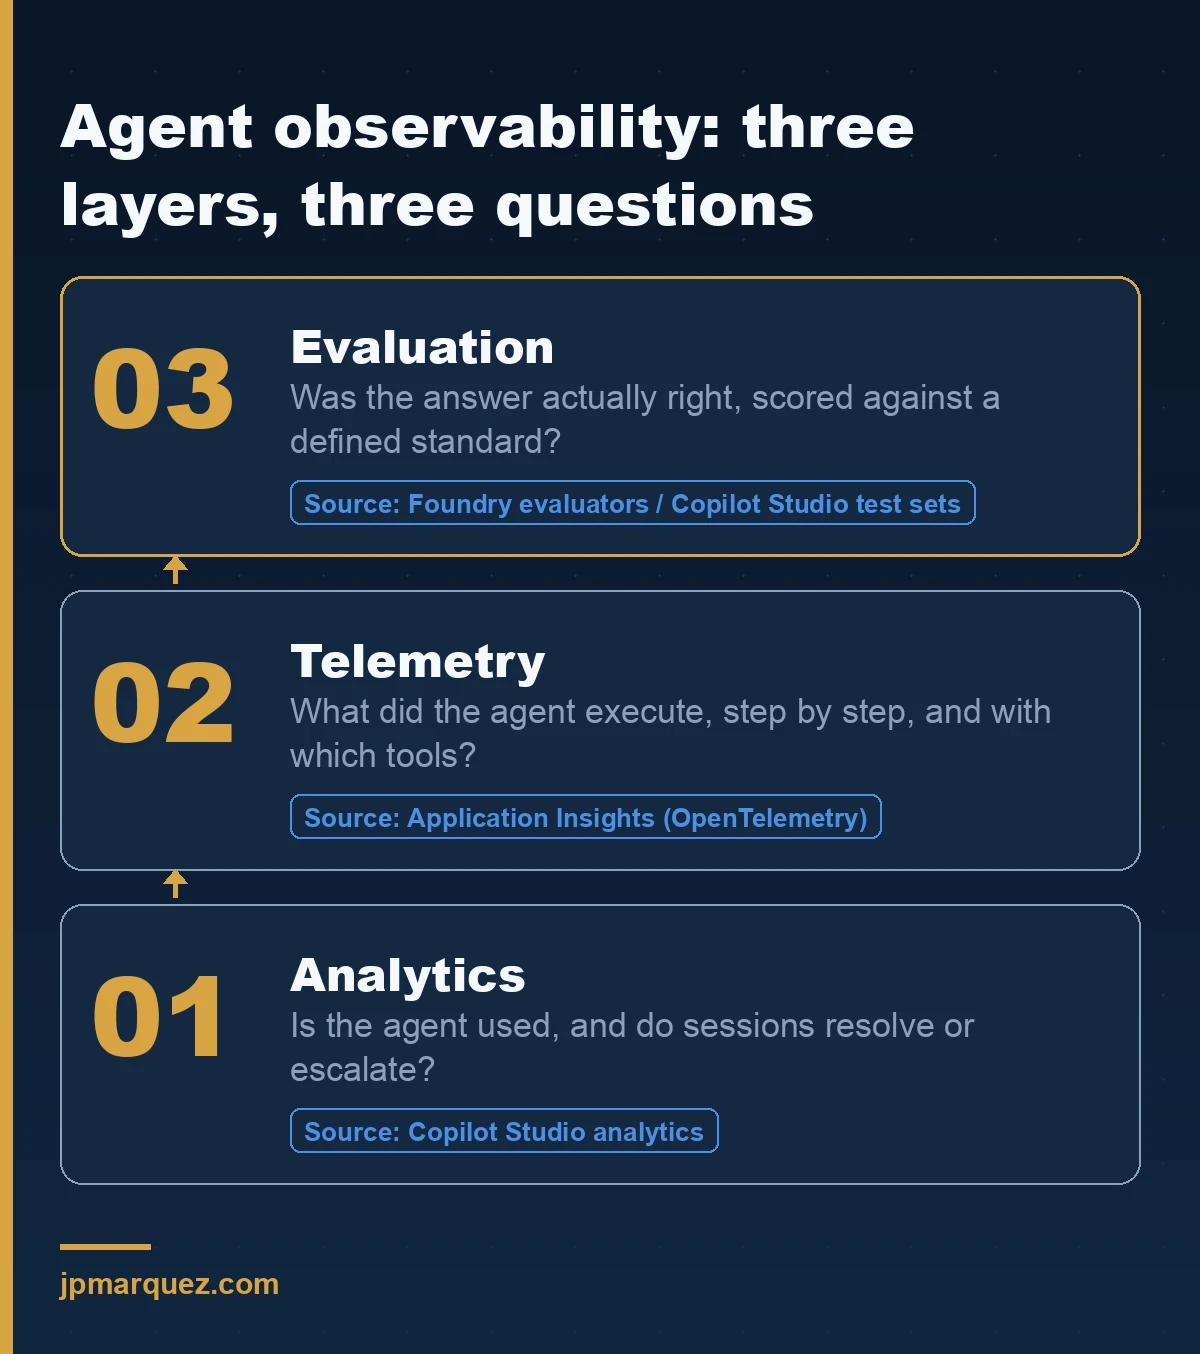
Layer one is free and shallow. Copilot Studio analytics gives you sessions, engagement, resolution and escalation, plus a separate view for autonomous agents covering runs and trigger health. Useful for adoption conversations. Useless for correctness.
Layer two costs money and gives you the truth. Copilot Studio can export telemetry to Application Insights; Foundry agents write traces to the same kind of resource. Application Insights is part of Azure Monitor and needs an Azure subscription, which is the first place a Microsoft 365-only budget hits a wall.
Layer three is the one almost nobody has: an evaluator that reads the agent's output and scores it against a definition of good.
Why don't the built-in analytics tell you your agent is wrong?
Because they measure the conversation, not the answer. Engagement rate counts whether the user kept talking. Resolution rate counts whether the session ended without escalation. An agent that confidently answers with stale policy from a decommissioned site scores perfectly on both, right up to the moment it doesn't.
This is my one strong opinion in this article, and I'll defend it in any architecture review: an agent in production without a scheduled evaluation is an unmonitored service, whatever the dashboard says. We would never accept a payments API whose only health signal was "requests per hour". We accept it for agents because the analytics tab is pretty and it's on by default.
Agent-level or environment-level telemetry: which one do you turn on?
Environment-level, if you are the platform team. Agent-level telemetry is configured per agent by its maker and emits event-based data into customEvents, with no OpenTelemetry alignment. Environment-level telemetry (preview) is configured once for the whole environment by an administrator and emits trace/span data into dependencies, aligned with the OpenTelemetry semantic conventions for GenAI.
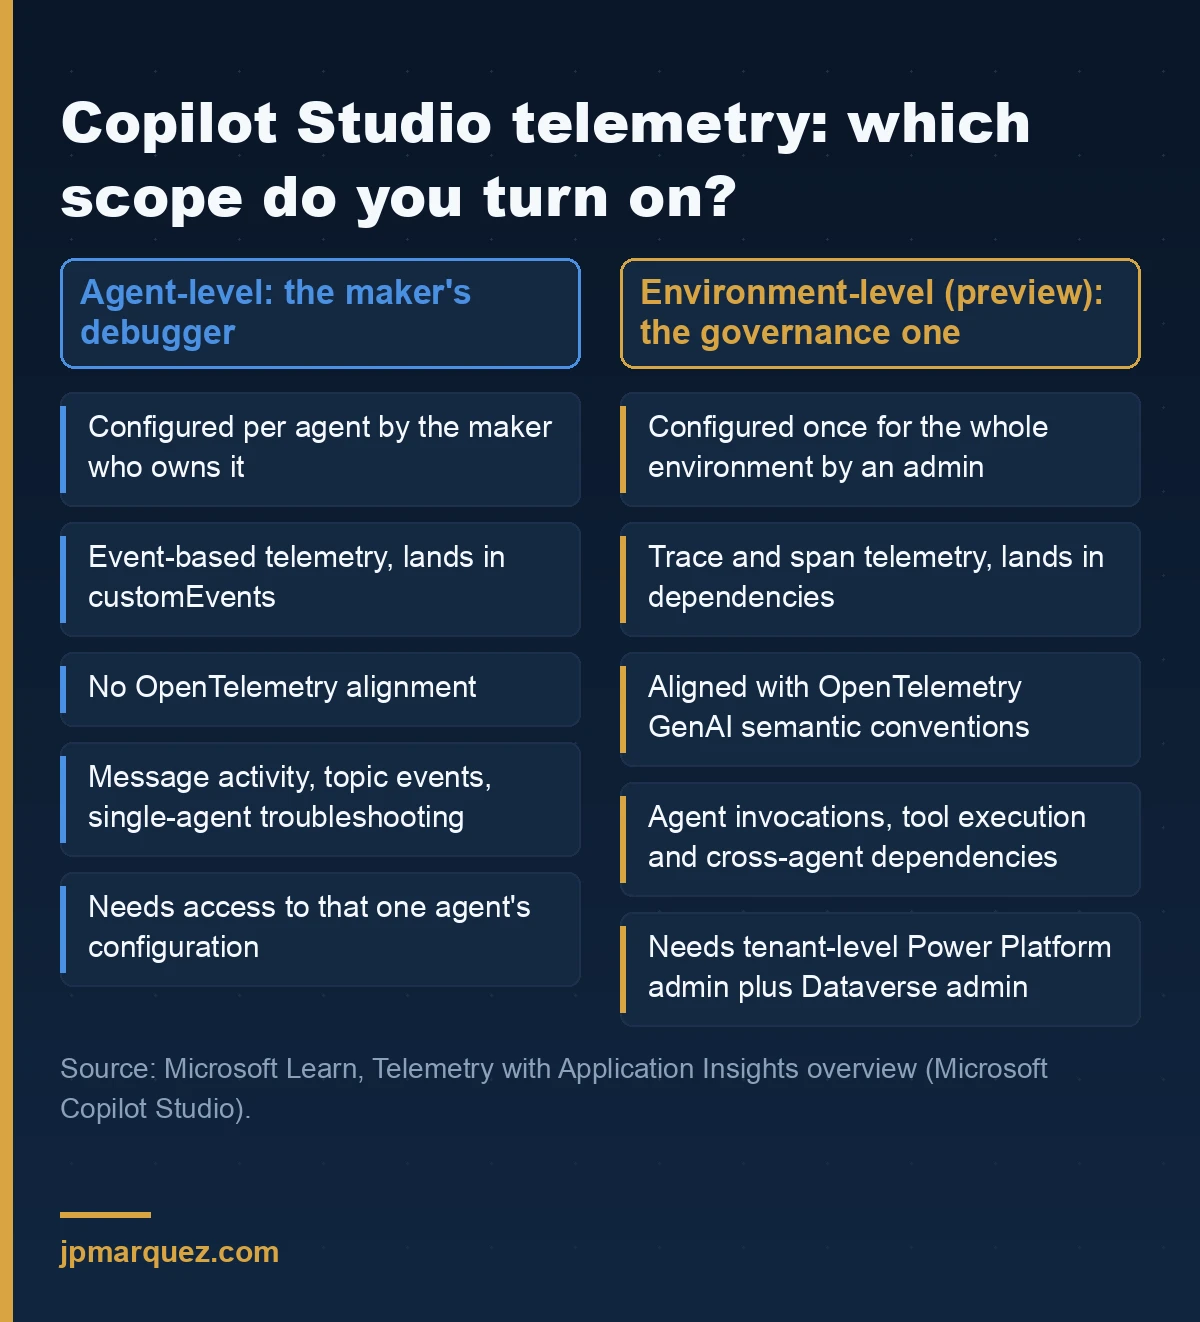
The distinction is not cosmetic. Environment-level telemetry captures agent invocations, tool execution, outputs and cross-agent dependencies — exactly the shape you need when one agent calls another and you have to explain which hop failed. It also requires tenant-level Power Platform or Dynamics 365 administrator privileges plus an admin role in the Dataverse environment, so it is not something a citizen developer switches on by accident.
Agent-level telemetry is a maker's debugger. Keep it for the team building the thing. Do not build your governance reporting on it, because you will end up with forty disconnected Application Insights resources and no tenant-wide view.
A practical note on cost: telemetry lands in your own Application Insights, and retention and billing follow that resource's configuration. A chatty agent with verbose custom dimensions can generate an ingestion bill nobody forecast. Sample deliberately. This is the same category of surprise I wrote about in the hidden cost of Copilot Studio agents — the meter you didn't know was running.
What do you actually evaluate in an agent?
Two things: the outcome and the path. Microsoft Foundry splits these explicitly. System evaluation asks whether the agent completed the task; process evaluation asks whether it took sensible steps to get there. An agent can reach the right answer through three wrong tool calls and one lucky guess, and only process evaluation will tell you.
The built-in agent evaluators map cleanly onto that split:
| Evaluator | Type | What it answers |
|---|---|---|
| Task Completion | System | Did the agent finish the job with a usable deliverable? |
| Task Adherence | System | Did it stay inside the rules in its instructions? |
| Intent Resolution | System | Did it understand what was being asked? |
| Task Navigation Efficiency | System | Did it take the expected route, or wander? |
| Tool Call Accuracy | Process | Right tool, right parameters? |
| Tool Selection | Process | Did it pick unnecessary tools? |
| Tool Input Accuracy | Process | Are all parameters correct and grounded? |
| Tool Output Utilization | Process | Did it use what the tool returned? |
| Tool Call Success | Process | Did the tool call error out? |
Most return a binary pass/fail; some, like Intent Resolution and Tool Call Accuracy, produce a 1–5 score that gets thresholded. Treat them as unit tests, not as a quality percentage to put on a slide.
Copilot Studio has its own, simpler apparatus. You build a test set and pick evaluation methods: General quality (an LLM judge scoring relevance, groundedness, completeness and abstention), Compare meaning, Tool use, Keyword match, Text similarity, Exact match, and Custom with your own instructions and labels. The Custom method is the one worth your time. It lets you encode a policy — "does this HR answer avoid giving legal advice?" — as a pass/fail label instead of a vibe.
Start with twenty test cases written by the business owner, not by IT. Twenty real questions beat two hundred synthetic ones.
How do you run evaluation continuously instead of once before go-live?
You attach evaluators to live traffic. In Foundry, the Agent Monitoring Dashboard reads from the Application Insights resource connected to your project and shows token usage, latency, run success rate, evaluation scores and red team results under the agent's Monitor tab. From its settings panel you configure recurring evaluations, scheduled red team scans and alerts.
Two modes, and the difference matters for your bill:
- Scheduled evaluation runs against a dataset on a fixed cadence. Deterministic, cheap, good for regression.
- Continuous evaluation samples live traffic as it happens. Closer to reality, and rate-limited — the default is 100 runs per hour, and once you hit it, runs are skipped rather than queued.
Two setup details that will cost you an afternoon if you skip them. The project's managed identity needs the Foundry User role for continuous evaluation rules to work at all. And reading the dashboard needs RBAC on the Application Insights resource plus Log Analytics Reader on the workspace; if the tables are protected, you also need Privileged Monitoring Data Reader. Empty charts are almost always permissions, not missing traffic.
For pre-production, wire evaluation into the pipeline rather than a human checklist. Foundry supports running evaluations from a GitHub Action, which turns "we tested the prompt change" into a gate that either passes or blocks. Pair it with AI Red Teaming Agent scans on a schedule and you have adversarial coverage that doesn't depend on someone remembering. If you are still deciding what belongs in each stage, this slots directly into gate four of the five-gate pilot-to-production framework.
What breaks in practice?
Four things, in the order I usually find them.
Your tool evaluators don't work with the tools you use. This is the trap for Microsoft 365 shops. The tool-related evaluators and groundedness currently have limited support when the conversation includes Azure AI Search, Bing Grounding, SharePoint Grounding, Code Interpreter, Fabric Data Agent or Web Search. If your agent grounds on SharePoint — and in a Microsoft 365 enterprise it usually does — you cannot lean on tool_call_accuracy to prove correctness. Plan for system evaluators plus a Custom evaluator instead, and design your test set knowing the gap exists.
Traces contain everything, including what shouldn't leave the room. Agent traces carry inputs and outputs verbatim. That is the point, and it is also a data protection problem the moment a user pastes a payroll table into a prompt. Foundry lets you restrict access to sensitive content in traces; decide who can read traces before you turn tracing on, not after. The same discipline applies to conversation transcripts in Copilot Studio, which have their own retention and access controls.
Nobody owns the dashboard. Observability without an on-call rota is decoration. Assign a named owner per agent, with a threshold that triggers action — latency above ten seconds and run success below 95% are the two the docs themselves flag as worth investigating. Write the numbers into the runbook.
Custom agents live outside the platform. If your agents run on Microsoft Agent Framework or anything else outside Foundry, you can still get them onto the same dashboard: instrument them to the OpenTelemetry GenAI semantic conventions, point them at the same Application Insights resource as the Foundry project, and register them. It's work. It's less work than running two monitoring estates.
What does a 30-day rollout look like?
Assume one production agent and a platform team that already has an Azure subscription.
- Days 1–3. Turn on environment-level telemetry in the Copilot Studio environment. Confirm spans are landing in
dependencies. Decide retention and sampling before volume grows. - Days 4–7. Connect Application Insights to the Foundry project. Assign the Foundry User role to the project managed identity. Fix the Log Analytics permissions now, not when the charts are empty.
- Days 8–14. Build a twenty-case test set with the business owner. General quality plus one Custom evaluator encoding a real policy. Run it manually. Record the baseline score — it exists so you can detect drift, not to make anyone look good.
- Days 15–21. Add a scheduled evaluation against that dataset and a continuous evaluation rule on live traffic with sensible sampling. Set alerts on latency, run success and evaluation score.
- Days 22–30. Wire the evaluation into the deployment pipeline as a gate. Schedule a red team scan. Name the owner, write the runbook, publish the two thresholds.
Key point: Thirty days is not fast. It's roughly the time it takes to find out that your permissions are wrong twice, which is the actual work.
Frequently asked questions
Do I need Azure to monitor a Copilot Studio agent?
For built-in analytics, no. For telemetry, yes: Application Insights is an Azure resource and requires an Azure subscription. This surprises Microsoft 365-only organisations regularly, and it is a budget conversation, not a technical one.
Is continuous evaluation the same as continuous monitoring?
No. Monitoring tracks operational signals — tokens, latency, success rate. Continuous evaluation samples live traffic and scores the quality of responses with evaluators. You want both; only the second one catches a correct-looking wrong answer.
Can I evaluate agents that don't run on Microsoft Foundry?
Yes, if you instrument them to the OpenTelemetry semantic conventions for generative AI and send telemetry to the same Application Insights instance as your Foundry project. Register the agent in the control plane and it appears alongside the rest.
How many test cases are enough?
Twenty real ones to start, growing to a few hundred as failure modes appear. The productive move is converting real production traces into evaluation datasets, so your test set is made of things users actually asked instead of things you imagined they would.
Which evaluator should I run first if I can only run one?
Task Adherence for a regulated process, General quality for a knowledge agent. Both catch the failure that matters most: an agent that answers when it should have declined.