Microsoft 365 Copilot ROI: A Metrics Framework CFOs Accept
· 10 min read
By Juan Pedro Márquez
Eighteen months into most Copilot deployments, the renewal conversation arrives and someone asks the only question that matters: what did we get for it? The teams that struggle are not the ones with low adoption — they are the ones who started measuring at month 17. This is the framework I use to make Copilot ROI defensible in front of a finance audience, using tooling you already have.
Why does "Copilot assisted hours" fail the CFO test on its own?
Because it is an estimate of assistance, not a measurement of realized value. The Copilot Dashboard computes assisted hours from user actions multiplied by research-derived multipliers, and even lets you convert hours to currency with a configurable hourly rate. Useful directional signal — but your CFO's second question is always the same: "Did anyone actually do anything with those saved hours?" Time assisted is not time recovered, and time recovered is not value captured unless something downstream improved: more output, faster cycle time, lower external spend.
A second reason for humility: measurement systems themselves have defects. Microsoft's own dashboard documentation discloses a known issue where email-related metrics (and consequently assisted hours and value) were underestimated from June 2025 to February 2026 before a fix. If your board deck quoted those months as gospel, you learned the lesson cheaply: triangulate, never single-source.
The three-layer framework
Layer 1 — Usage (are we even using the thing?)
The hygiene layer, straight from admin tooling:
- Adoption and intensity: active users, actions per user per app, trend by department — Copilot Dashboard's adoption tab plus the Microsoft 365 Copilot usage report.
- Readiness coverage: licensed vs. eligible users via the Copilot readiness report.
- Agent usage: if you build agents, their conversation volumes and resolution come from Copilot Studio analytics.
Layer 1 answers "is the asset deployed?" — necessary, never sufficient. A license used daily for mediocre summaries is still cost.
Layer 2 — Behavior (is work changing?)
This is where Viva Insights advanced analysis earns its keep: meeting hours, after-hours work, email load, focus time — compared between matched populations (Copilot users vs. similar non-users) rather than before/after for everyone. The dashboard's own documentation is admirably blunt here: Copilot is "not likely to be solely responsible for any metric differences" — seasonality, reorgs and role mix move these numbers too. Use cohort comparisons and trend deltas, present them as evidence, not proof.
Add the human layer: Viva Pulse's Copilot impact surveys feed sentiment directly into the dashboard. High usage + low satisfaction is your enablement backlog, visible before it becomes churn.
Layer 3 — Business outcomes (the slide the CFO keeps)
The layer nobody can give you out of the box, because it lives in your systems: proposal turnaround time, case resolution time, content production volume, external agency spend, onboarding time-to-productivity. The mechanism exists to bring it together — Copilot Analytics' business impact reporting explicitly supports joining your organizational KPIs (from SAP, Salesforce, Workday, or a CSV) with usage data, and the Copilot Control System's measurement pillar frames the whole stack.
Pick 2-3 processes maximum, instrument them before broad rollout, and write the target on the wall: "RFP responses from 9 days to 6", "tier-1 tickets deflected 25%". A narrow claim you can defend beats a broad one you cannot.
The 90-day measurement plan
- Weeks 1–2: baseline. Capture Layer 2 metrics and your 2-3 Layer 3 KPIs before enablement reaches the pilot group. No baseline, no story — this is the single most common omission I see.
- Weeks 3–10: run. Pilot cohort vs. matched control. Monthly snapshot of all three layers in one page (admin reporting options cover the plumbing).
- Weeks 11–13: verdict format. One slide per layer: deployed (L1), changed (L2), delivered (L3) — each with its caveat stated, which paradoxically increases credibility.
What to put in the renewal deck (and what to leave out)
In: cohort deltas with confounders named; the 2-3 business KPIs against their pre-agreed targets; satisfaction trend; cost per active user vs. assisted value range (clearly labeled as estimate).
Out: company-wide before/after averages (confounded), assisted-value figures quoted to the euro (false precision), and any metric from a period with a known data issue — check the service health notes first.
Related reading: Why 80% of Enterprise M365 Copilot Deployments Stall at 90 Days · Getting Started with Microsoft 365 Copilot
Frequently asked questions
Do I need Viva Insights licenses to start?
The Copilot Dashboard is available without paid Viva Insights for basic categories; richer cohort analysis, benchmarks and custom queries scale with licensing (the dashboard docs detail tiers by license count). Start with what you have; buy depth when Layer 3 questions demand it.
What is a realistic adoption bar before measuring impact?
Measure impact only on genuinely active cohorts (multiple actions per week, sustained). Diluting Layer 2/3 analysis with barely-active licensees is the fastest way to a false "no effect".
Our pilot shows assisted hours but flat business KPIs. Now what?
That is a finding, not a failure: assistance is not flowing into the bottleneck. Usually the constraint sits elsewhere (approval steps, capacity, demand). Move the pilot to a process where time is the binding constraint — and say exactly that in the readout.
How long before ROI is credible?
Two full quarters with a baseline beats four quarters without one. The calendar matters less than the discipline of before/after on the same narrow process.
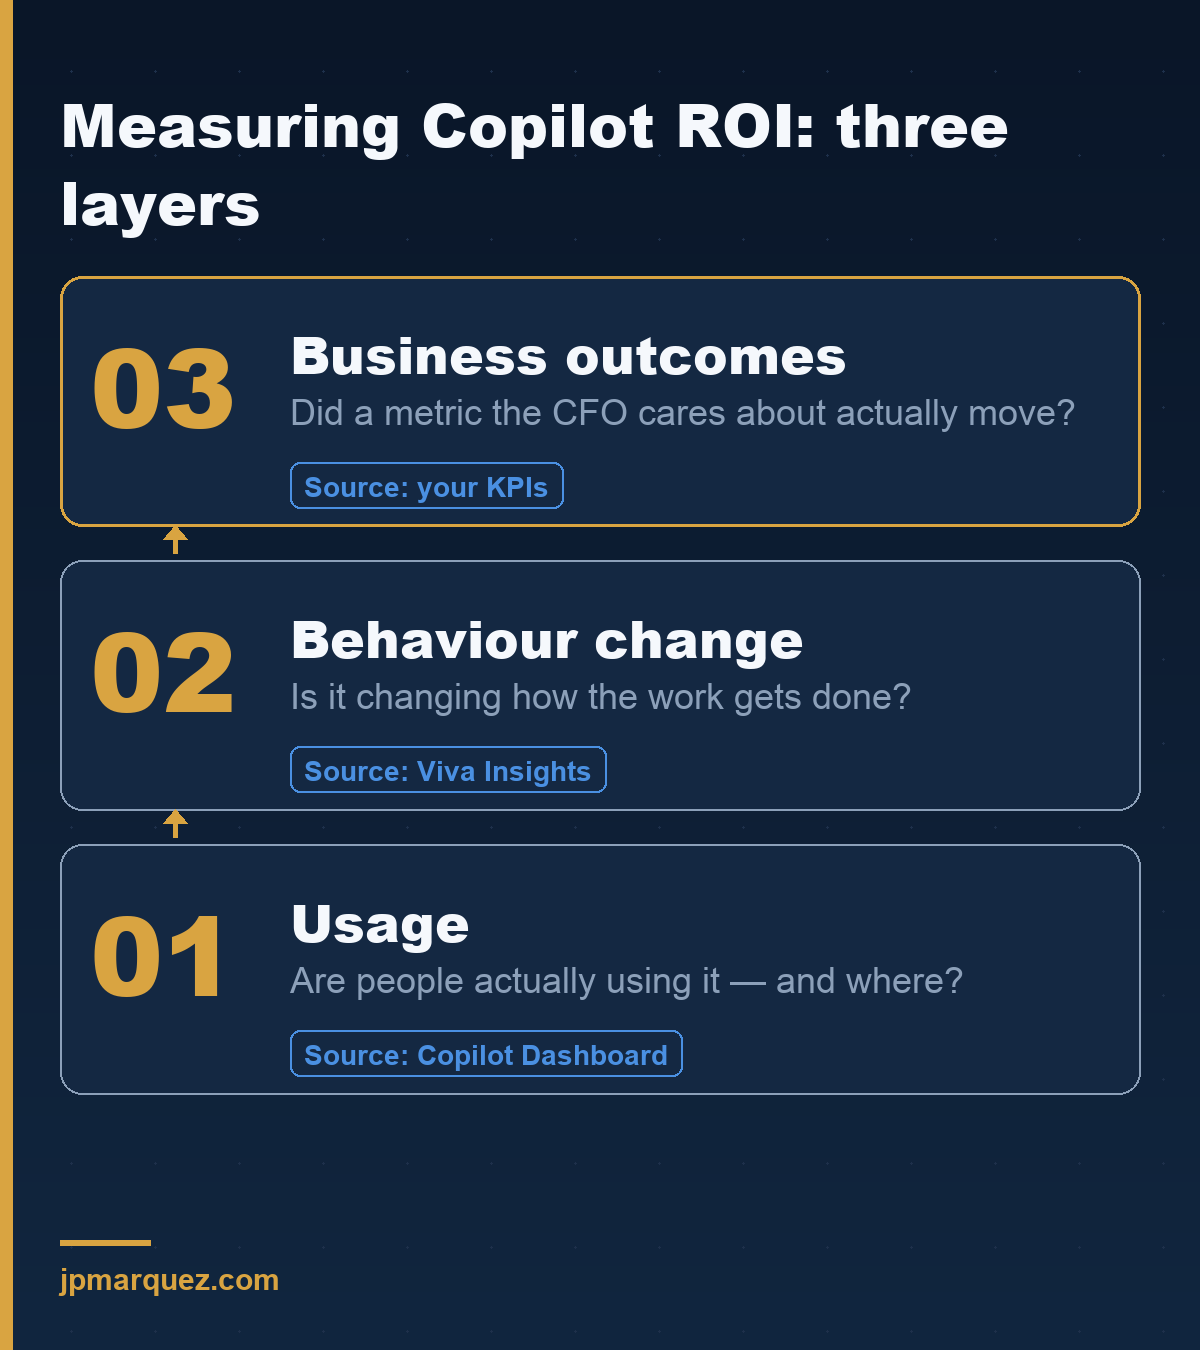
Where to find each layer
- Usage — are people using Copilot, and where? The Microsoft 365 admin center reports and the Copilot Dashboard (linked above).
- Behaviour change — is it changing how the work gets done? Viva Insights advanced analysis and Viva Pulse Copilot impact surveys.
- Business outcomes — did a metric the CFO cares about move? Your own KPIs and BI, tied to the use cases you prioritised.
Start at the bottom and only climb once each layer is solid — a business-outcome number with no usage or behaviour data beneath it is the one a CFO will not trust.